

Body Mass Index
The Body Mass index (BMI) is a widely used diagnostic tool for assessing body weight. Its was invented by Adolphe Quetelet (1832).

BMI is calculated as shown below:
BMI = weight (kg) / height2 (m)
|
BMI |
Categorization |
|||
|---|---|---|---|---|
| Table 1: Body volume index categorization | ||||
| <18.5 | Underweight | |||
| 18.5-24.9 | Normal | |||
| 25.0-29.9 | Overweight | |||
| >30 | Obese | |||
| >40 | Morbidly obese | |||
ASA Physical Status Assessment
The physical status classification system of the American Anaesthesiologist Society was created in 1941, aiming at assissing the physical condition of a patient prior to selecting the type of anaesthesia to be used or the performance of a surgical procedure.
The description of a patient’s pre-op physical status is used so as to improve data recording and facilitate communication amongst physicians; it also helps as a uniform statistical analysis system. The classification is not intended for the prediction of intraoperative risk.
Modern classification comprises six categories, as described below:
|
ASA Category |
Pre-op health status |
Comments / Examples |
||
|---|---|---|---|---|
| Table 2: ASA Assessment Table according to physical status | ||||
|
I |
Healthy patient |
Without physical, physiological or mental disorders. Extremely young and old ages are exempted. Healthy individuals tolerating physical exercise well |
||
|
II |
Patients with mild systemic disease |
Withoutactivity limitation. Well- controlled condition of one of the body's systems. Controlled hypertension or diabetes without systemic complications, smoking without chronic obstructive pulmonary disease (COPD), mild obesity, pregnancy |
||
|
III |
Patients with serious systemic disease |
There is activity limitation. Controlled condition of one or more systems. There is no immediate danger of death. Congestive Heart Failure (CHF), stable angina, past heart episode, uncontrolled hypertension, morbid obesity, chronic renal failure, bronchial asthma with periodic symptoms |
||
|
IV |
Patient with a serious systemic disease under constant threat of death |
There is at least one serious illness that is not sufficiently controlled or is at its final stages. There is risk of death. Unstable angina, symptomatic COPD, symptomatic CHF, liver and kidney failure
|
||
|
V |
Patients who are not expected to survive without the operation |
They are not expected to survive without surgery for more than 24 hours. There is immediate risk of death. Multiple organ failure, septic syndrome with hemodynamic instability, hypothermia, uncontrolled coagulation dysfunctions |
||
|
VI |
Brain dead patient who is to become an organ donor |
|
||
Calculator of Free Testosterone

Free testosterone cannot be reliably measured in a direct manner.
This is why lab measurements of albumin, SHBG and testosterone are taken, and then a formula is used to calculate free testosterone; the formula can be found at the following link: http://www.issam.ch/freetesto.htm
Bladder Capacity Calculation
Calculation of normal maximum expected urinary bladder capacity during childhood
-
1. The commonest mathematical formula was based on the observation that the capacity of a child's bladder increases by approximately 30ml per year up to the age of 8.
According to this formula, the expected capacity of a child's bladder is Y = 30 +30X, where Y is bladder capacity in ml and X is age in years. (Picture 1)
-
2. A second mathematical formula was based on the discovery that the relationship of age and capacity is not linear.
Thus, for infants aged <2 the following equation was proposed: Y = (SX + 2)28.35ml, while for children aged >2 the following equation was proposed: Y = (X/2 +6)28.35ml, where Y is bladder capacity in ml and X is age in years. (Picture 2)


- Bibliography
-
Kirk J, Rasmussen PV, Rittig S and Djurhuus JC. Micturition habits and bladder capacity in normal children and in patients with desmopressin-resistant enuresis. In: Nørgaard JP, Djurhuus JC, Hjälmås K, Hellström A.-L and Jørgensen TM (eds.). Proceedings, Second International Workshop, International Enuresis Research Center, Aarhus. Scand J Urol Nephrol 1995; 173: 49-50.
-
Akbal C, Genc Y, Burgu B, Ozden E, Tekgul S. Dysfunctional voiding and incontinence scoring system: quantitative evaluation of incontinence symptoms in pediatric population. J Urol. 2005; 173: 969-73.
Pelvic Floor Muscle Assessment cale

Pelvic floor muscles are assessed and ranked on the Oxford Table, like all skeletal muscles.
The Guideline Task Force of the Physiotherapy Association in England proposed the Oxford System as a standard method for assessing incontinence. The system has proved to offer trial-countercheck credibility.
This vaginal assessment of pelvic floor muscles allows for the planning of exercise regimens and is now a standard “international tool” for health professional communication and comparative study reports. The method describes the strength of the pelvic floor muscles on a scale from 0 to 5
Often, specialist pelvic floor physical therapists add the symbols +/-, in order to indicate intermediate conditions.
|
Degree |
Contraction |
Proposed physical therapy |
||
|---|---|---|---|---|
| Table 3: Assessment scale of pelvic floor muscles | ||||
|
0 |
none | electric stimulation or biofeedback | ||
|
1 |
very weak (slight movement felt by examiner's finger) | electric stimulation or biofeedback | ||
|
2 |
weak (mild feeling of tension on examiner's finger) | electric stimulation or biofeedback | ||
|
3 |
moderate (the posterior vaginal wall elevates) | pelvic floor muscle regimen | ||
|
4 |
good (the posterior vaginal wall elevates, despite the resistance of the examiner's finger) | pelvic floor muscle regimen | ||
|
5 |
strong (the examiner's finger is squeezed) | pelvic floor muscle regimen (preventively) | ||
The scale used for the assessment of pelvic floor muscles in the overall assessment system proposed by Laycock and Jerwood is internationally known as “The PERFECT Scheme”. It is a reliable method that records the strength, stamina, repetitions and number of quick contractions that the patient can perform before muscular fatigue.
|
P |
Power (pressure) |
Strength (according to the Oxford Scale) |
||
|---|---|---|---|---|
| Table 4: Pelvic floor muscle assessment scale | ||||
|
E |
Endurance | Stamina (time before strength decreases by 35%) | ||
|
R |
Repetitions | Contraction repetitions with 4 second rest intervals (maximum of 10) | ||
|
F |
Fast | Fast contractions after 1 minute's rest (maximum of 10) | ||
|
ECT |
Every Contraction Timed | Reminder: record both the number of contractions and the duration of each contraction | ||
For every patient, the complete assessment includes 4 numbers, reflecting power/duration/repetitions/quick contractions. Thus, the assessment of the pelvic floor muscles can be reported as follows: 4/6/5//9
This assessment is analysed as follows:
- 4 = good contraction(power according to the Oxford Scale)
- 6 = 6 second duration (contraction duration)
- 5 = number of repetitions
- 9 = quick contractions (following one minute's rest)
Literature References
-
Laycock, J., Jerwood, D. (2001) Pelvic floor assessment the PERFECT scheme. Physiotherapy. 87: 12: 631-642.
Konstantinidou, E. The Role of Training Pelvic Floor Muscles in Stress Incontinence Treatment. Physical Therapy, 8(4), 213-220, 2005.
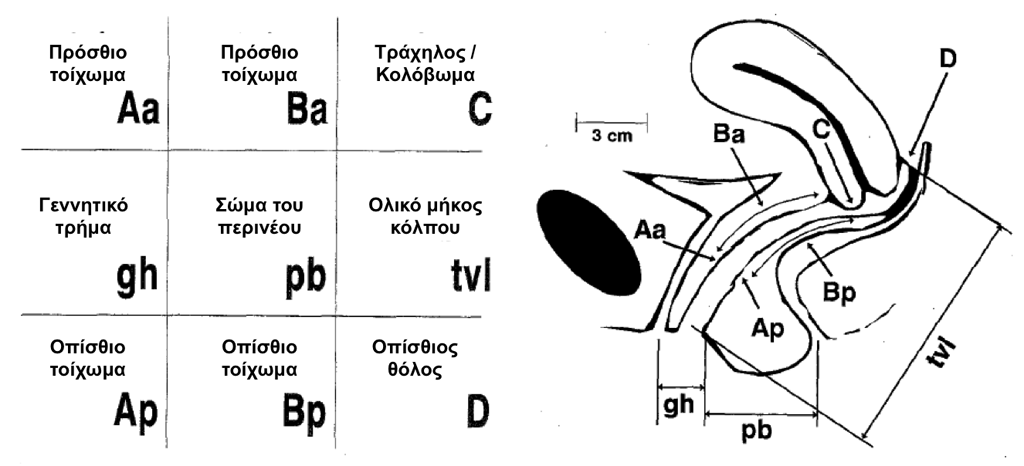
POP-Q Quantification System
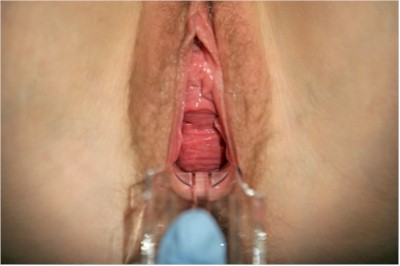
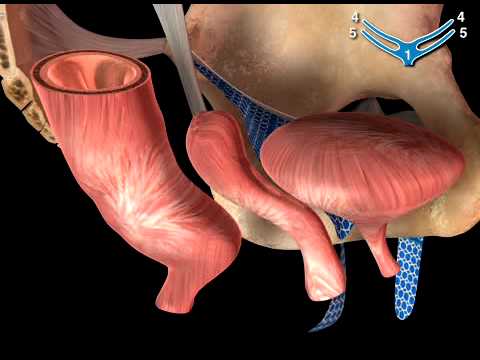
Cystocele, rectocele and uterine prolapse often concern Urologists and Gynaecologists. Prolapse quantification is important for the prognosis of post-operative outcomes, as well as for research purposes.
Many classifications have been proposed over the years and have been presented quite successfully in Mouritsen's article (Mouritsen L. Best Pract & Res Clin Obstet Gynaecol. 2005; 6: 1-17).
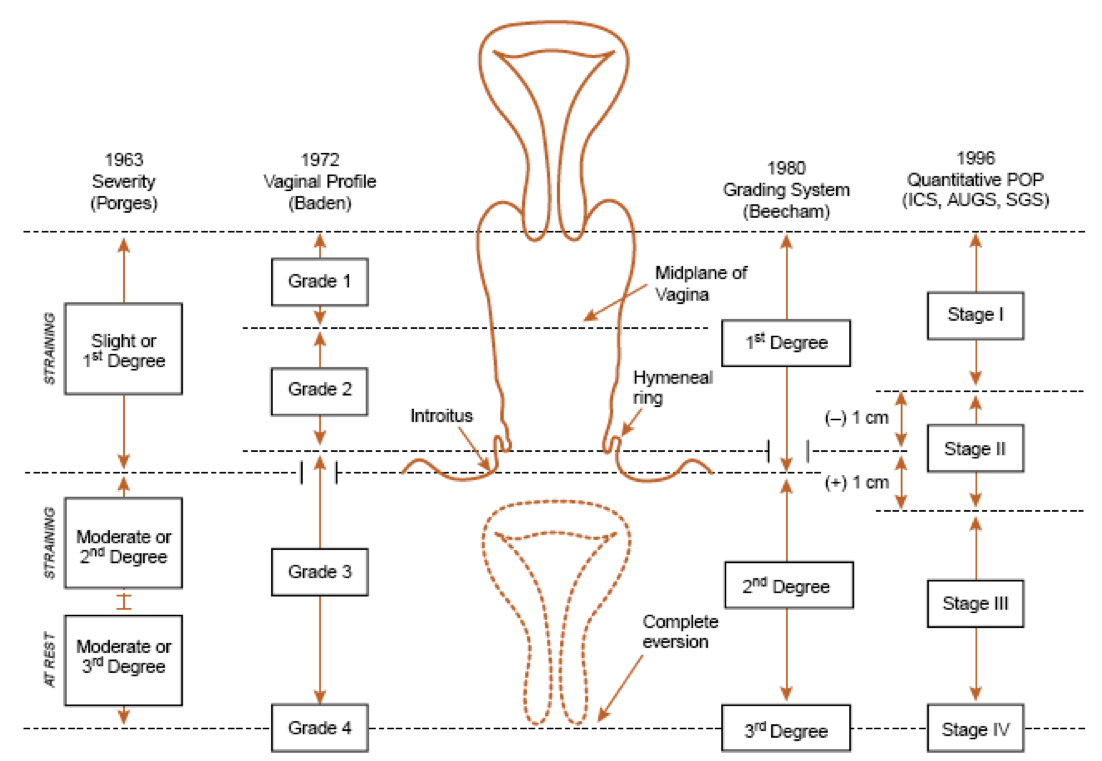
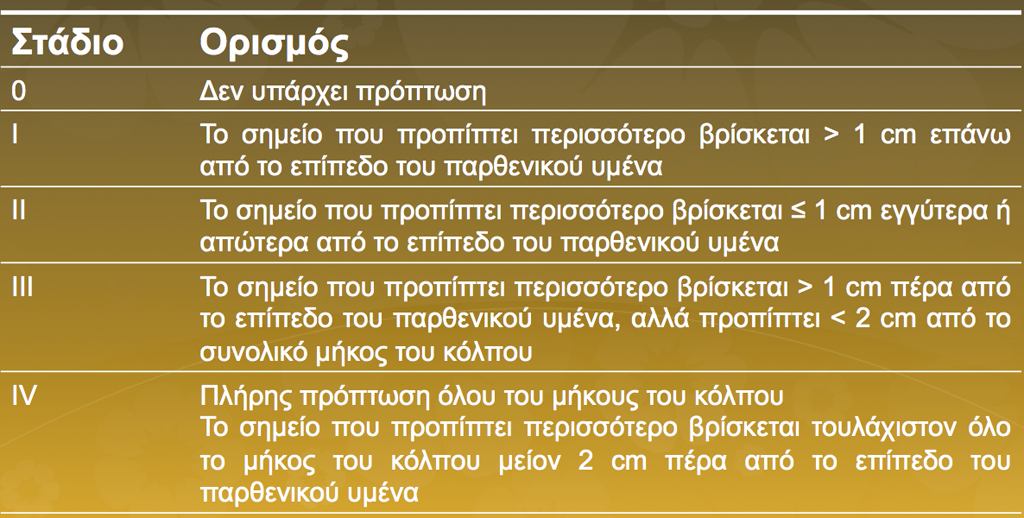
The International Continence Society has proposed the following classification (Bump et al, Am J Obstet Gynecol 1996; 75:1)
ASIA Spinal cord impairment classification
ASIA impairment Scale
Injuries to the spinal cord are classified based on the scale of the American Spinal Injury Association - ASIA
|
TYPES
|
Damage
|
Neurological picture | ||
|---|---|---|---|---|
| Table 5: ASIA Scale of Spinal impairment classification | ||||
|
A |
Full (there is no function) |
Lack of morot or sensory function at the S4-S5 spinal |
||
|
B |
Imperfect: only motory function preserved |
Lack of motor function as well as imperfect sensory function below the level of spinal cord damage. |
||
|
C |
Imperfect: partial motor and sensory function preserved |
Presence of motor function below the level of spinal cord damage, with at least half of the key muscles below the damage retaining muscle power lower than level 3. |
||
|
D |
Imperfect: basic motor functions preserved |
Presence of motor function below the level of spinal cord damage with at least half of the key muscles below the damage retaining muscle power of at least level 3. |
||
|
E |
Normal functionality |
Normal motor and sensory function below the level of damage. |
||
Click here to find a special neurological assessment form
You can also find instructions on neurological assessment.
Assessment of testicle volume and penis length
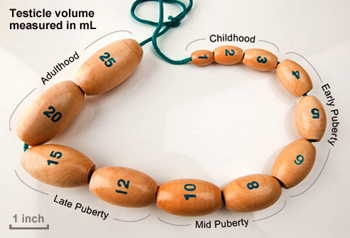
Testicle volume in adult life ranges between 15-25ml.
Average penis length during erection is 13cm.
Growth is completed at 14 years of age. Therefore, any hormonal intervention must be made early on.
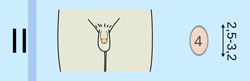
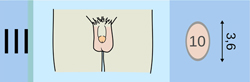
Tanner Staging
| Table 6: Tanner Stage Scale | ||||
|
Tanner I: Prepubescent (volume smaller than 1.5ml, small penis length 3cm or less) [typical of ages 9 and younger]. |
 |
|||
|
Tanner II: Volume of testicles between 1.6 and 6ml. The skin of the scrotum grows thinner, takes on a red shade and grows. Penis length unchanged [ages 9-11] |
 |
|||
|
Tanner III: Testicle volume between 6 and 12ml. Further enlargement of scrotum. Penis length approximately 6cm [ages11-12.5] |
 |
|||
|
Tanner IV: Testicle volume between 12 and 20ml. Further enlargement of scrotum, which takes on a darker colour. Penis length approximately 10cm and girth increase [ages 12,5-14]. |
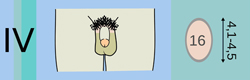 |
|||
|
Tanner V: Testicle volume greater than 20ml. Adult scrotum. Penis length 15cm [ages 14+] |
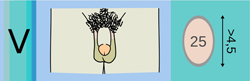 |
|||
Penis length in children
|
AGe |
Penis length (in cm) (mean value ± standard deviation) |
|||
|---|---|---|---|---|
| Table 7: Table by Feldmann and Smith on Microphallus (Micropenis) | ||||
| Neonates |
3,5±0,4 |
|||
| 0-5 months |
3,9±0,8 |
|||
| 6-12 months |
4,3±0,8 |
|||
| 1-2 years |
4,7±0,8 |
|||
| 2-3 years |
5,1±0,9 |
|||
| 3-4 years |
5,5±0,9 |
|||
| 4-5 years |
5,7±0,9 |
|||
| 5-6 years |
6,0±0,9 |
|||
| 6-7 years |
6,1±0,9 |
|||
| 7-8 years |
6,2±1,0 |
|||
| 8-9 years |
6,3±1,0 |
|||
| 9-10 years |
6,3±1,0 |
|||
| 10-11 years |
6,4±1,1 |
|||
| Adults |
13,3±1,6 |
|||